
The following results were generated using MT5 (MetaTrader 5) backtesting.
Below are the yearly results for Bitcoin and Ethereum.
Note:
In the balance graphs shown in each test result, the sharp decline near the end occurs because all unrealized losses are forcibly closed when the backtest ends.
Under real trading conditions, positions would normally remain open, meaning those unrealized losses would continue fluctuating and could eventually recover into profit.
Bitcoin / USD — 2023
Assumed trading range: $5,000 to $50,000
Grid interval: Buy every $500 drop
Position size per trade: 0.01 BTC
Total profit-taking cycles: 295
Total profit: $1,472.83
Risk profile: Position sizing adjusted to remain close to 1x exposure
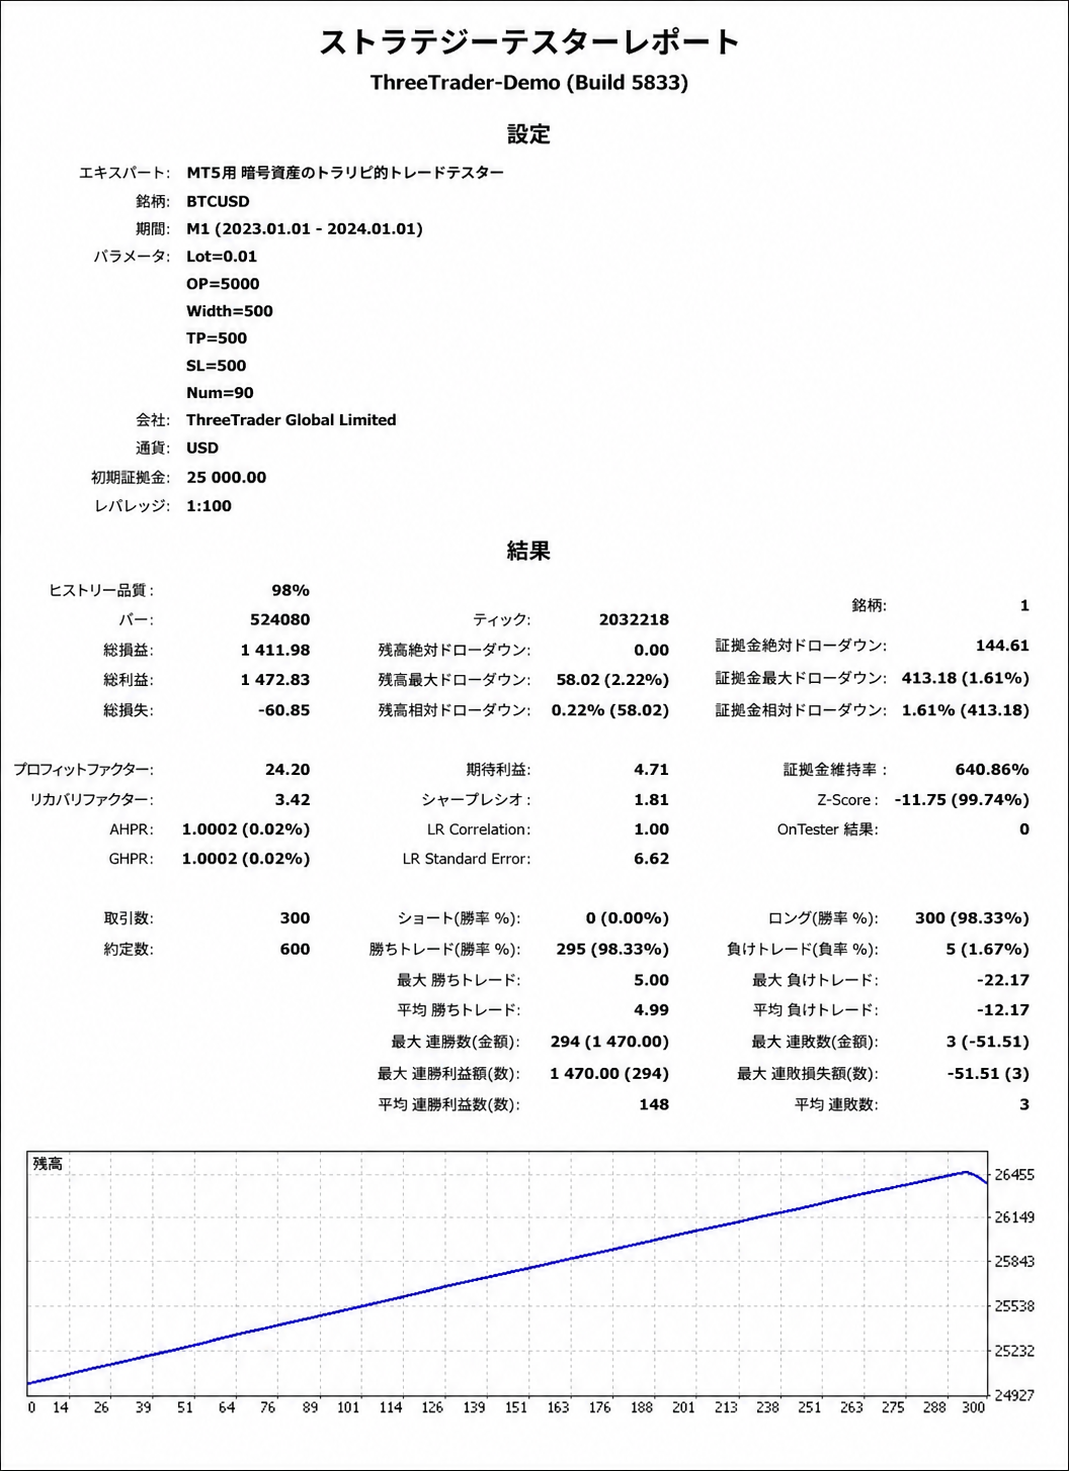
In this test, Bitcoin was traded repeatedly within the $5,000–$50,000 range.
The strategy bought 0.01 BTC every time the price declined by $500 and sold 0.01 BTC whenever the price rebounded by $500.
As a result, the system completed 295 profit-taking cycles during 2023, generating approximately $1,472.83 in profit.
Bitcoin / USD — 2024
Assumed trading range: $30,000 to $110,000
Grid interval: Buy every $1,000 drop
Position size per trade: 0.005 BTC
Total profit-taking cycles: 606
Total profit: $3,030.00
Risk profile: Position sizing adjusted to remain close to 1x exposure
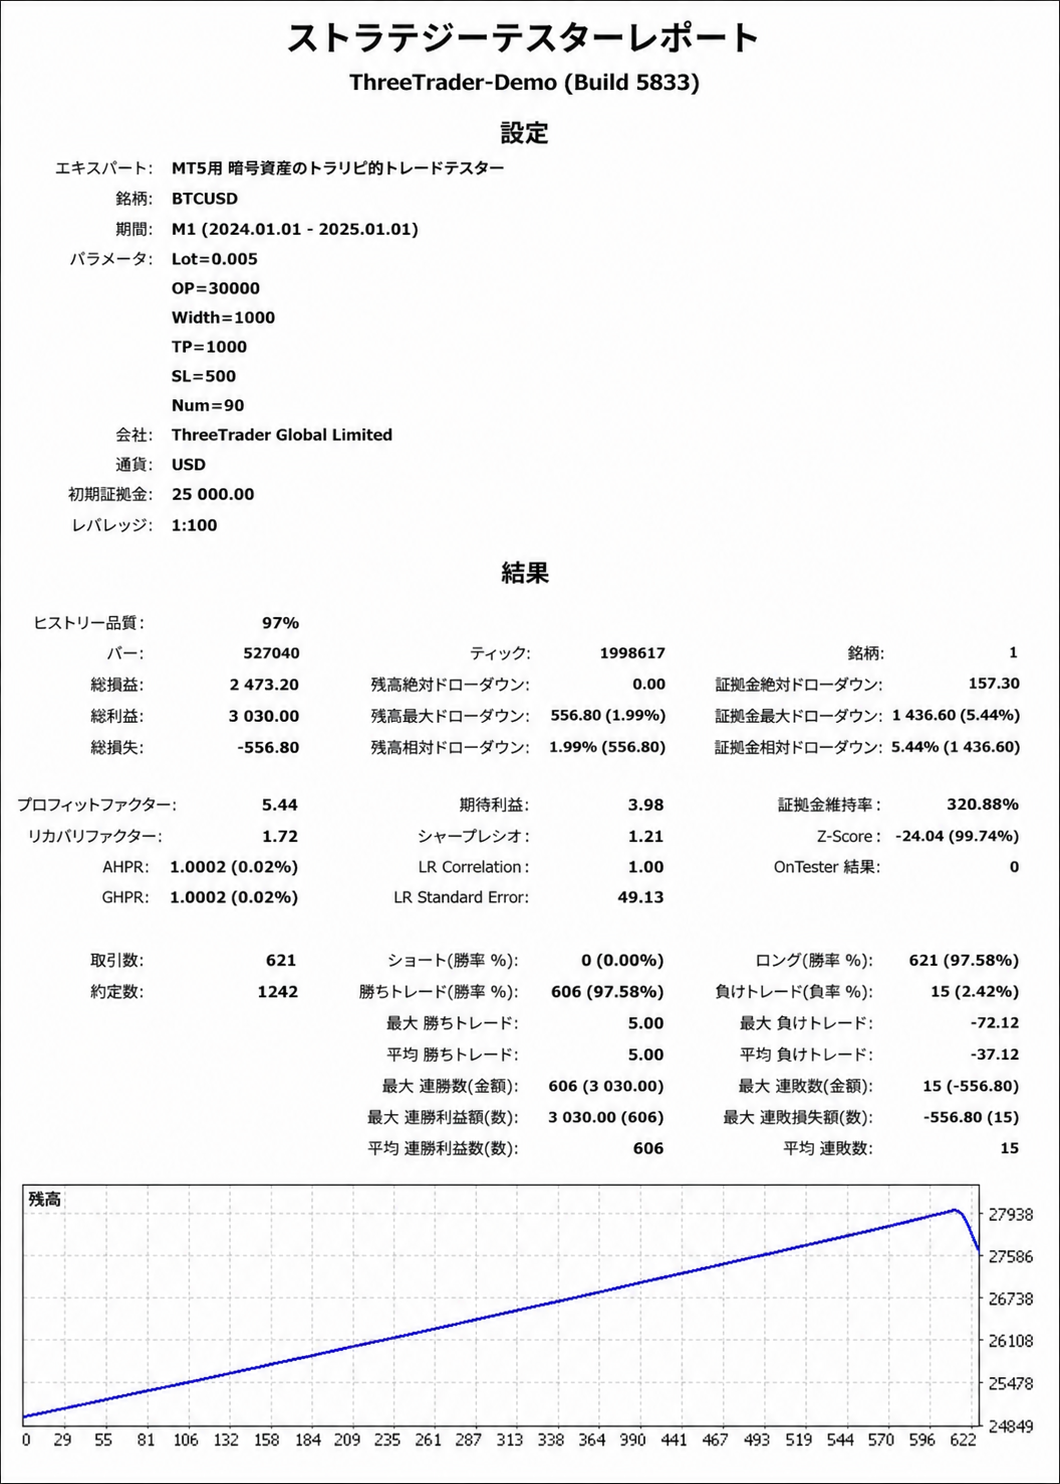
In this test, Bitcoin was traded repeatedly within the $30,000–$110,000 range.
The strategy bought 0.005 BTC every time the price dropped by $1,000 and sold 0.005 BTC whenever the price rebounded by $1,000.
During 2024, the system completed 606 profit-taking cycles, generating approximately $3,030 in profit.
Bitcoin / USD — 2025
Assumed trading range: $50,000 to $130,000
Grid interval: Buy every $1,000 drop
Position size per trade: 0.004 BTC
Total profit-taking cycles: 836
Total profit: $3,344.00
Risk profile: Position sizing adjusted to remain close to 1x exposure
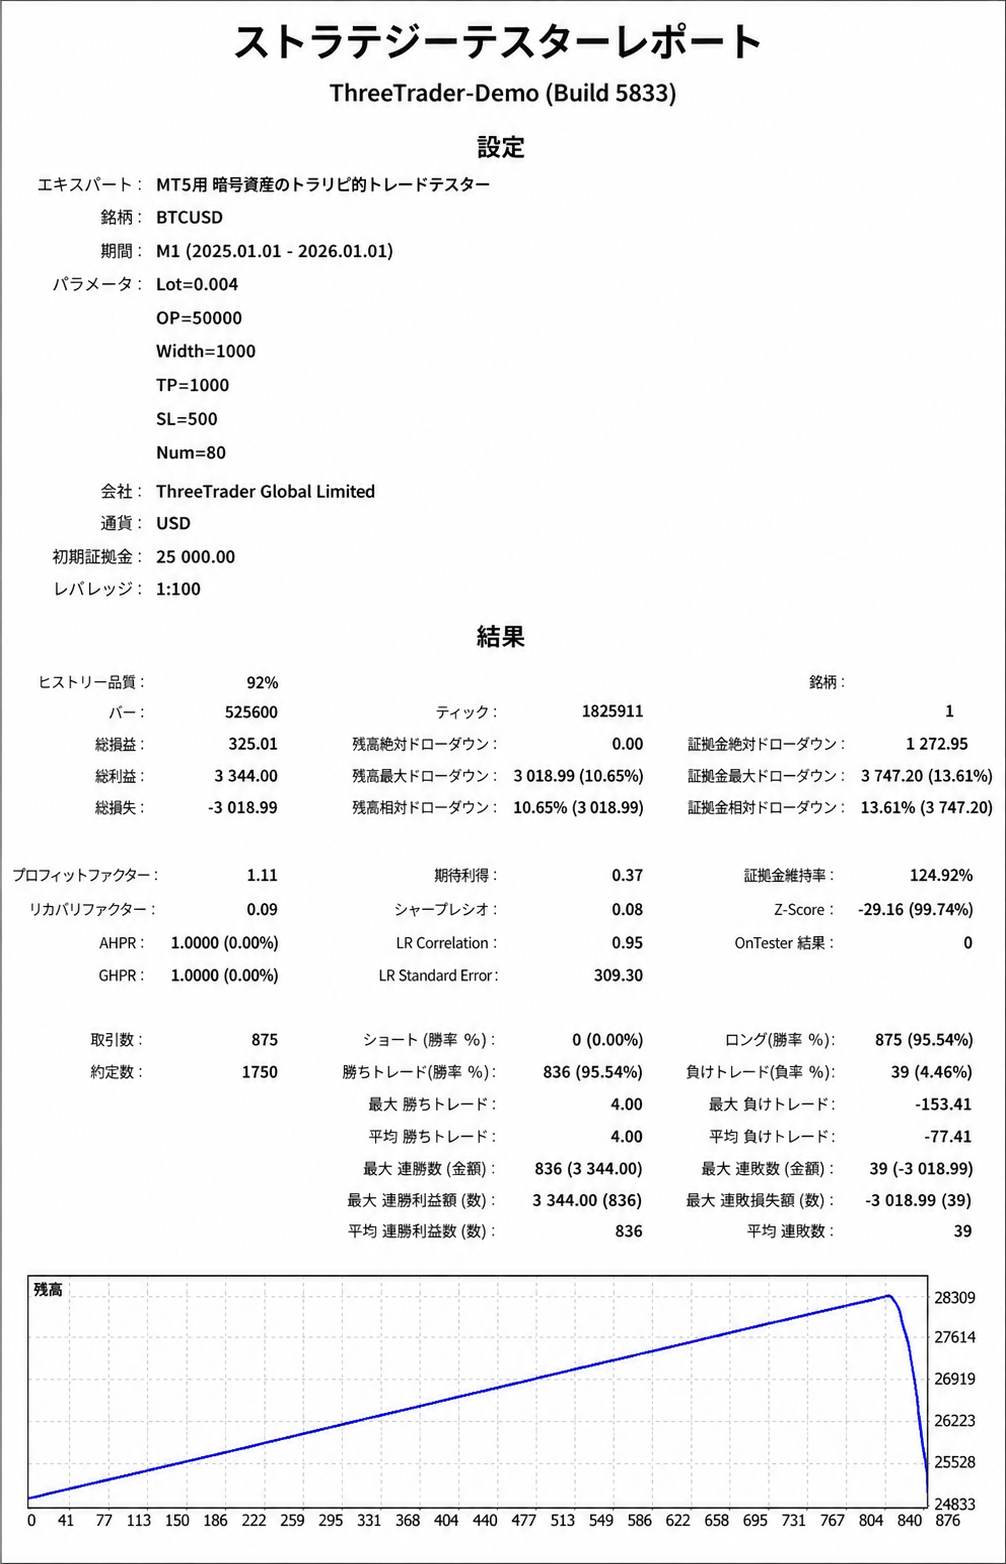
In this test, Bitcoin was traded repeatedly within the $50,000–$130,000 range.
The strategy bought 0.004 BTC every time the price dropped by $1,000 and sold 0.004 BTC whenever the price rebounded by $1,000.
During 2025, the system completed 836 profit-taking cycles, generating approximately $3,344 in profit.
Ethereum / USD — 2023
Assumed trading range: $500 to $2,500
Grid interval: Buy every $50 drop
Position size per trade: 0.4 ETH
Total profit-taking cycles: 132
Total profit: $3,300.00
Risk profile: Position sizing adjusted to remain close to 1x exposure
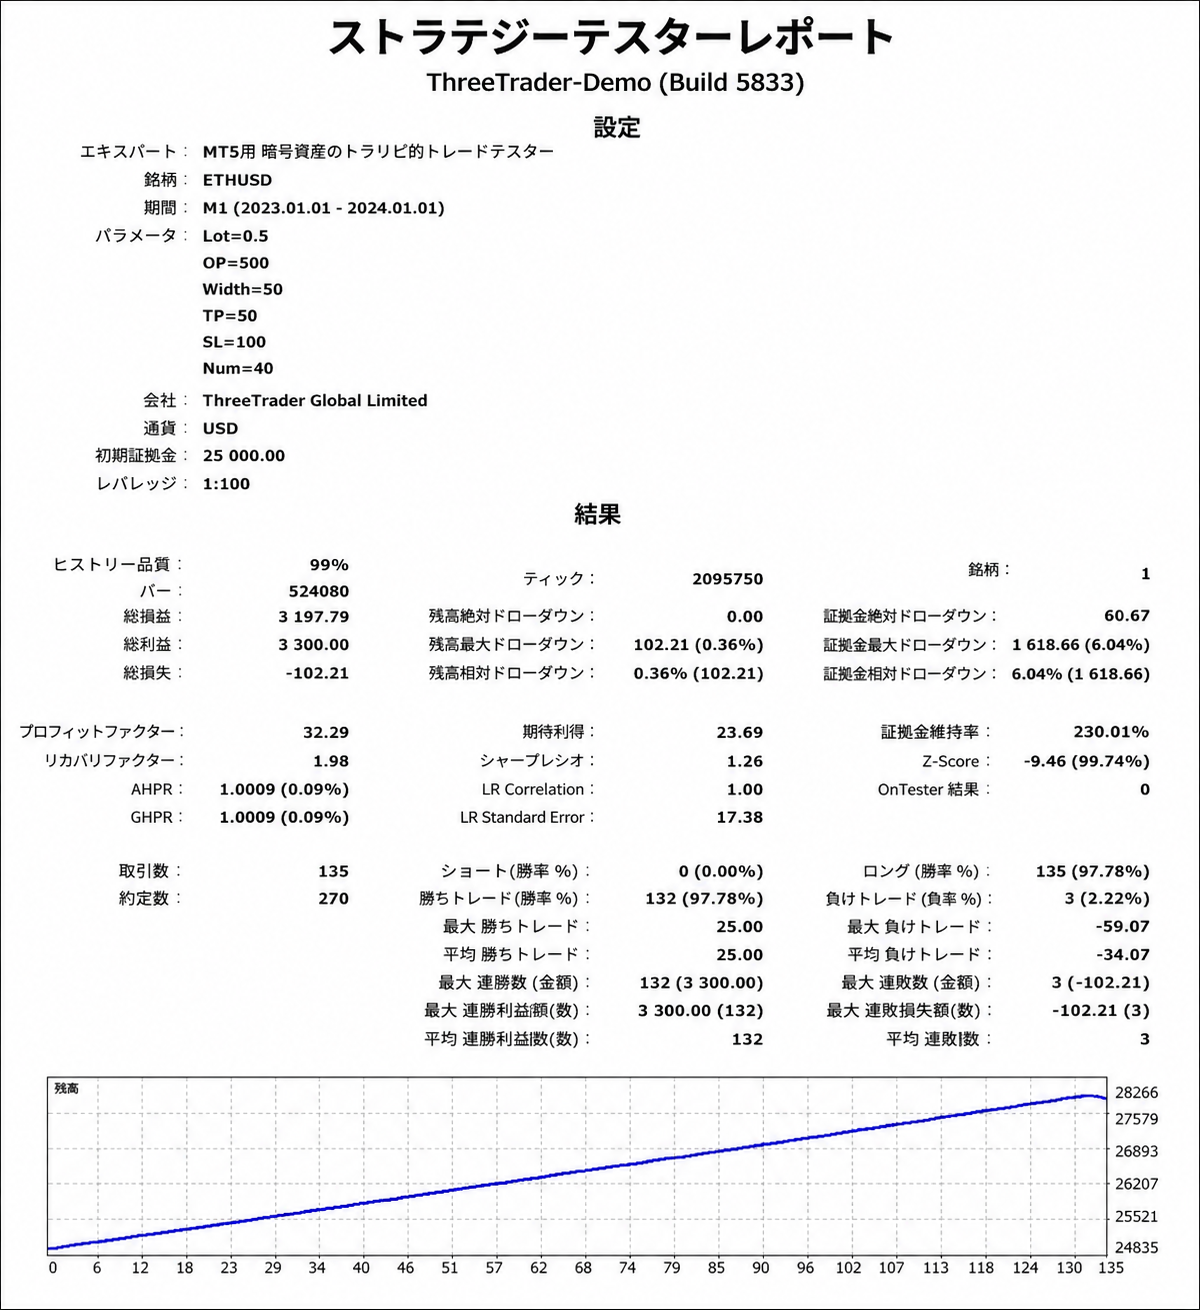
In this test, Ethereum was traded repeatedly within the $500–$2,500 range.
The strategy bought 0.4 ETH every time the price dropped by $50 and sold 0.4 ETH whenever the price rebounded by $50.
During 2023, the system completed 132 profit-taking cycles, generating approximately $3,300 in profit.
Ethereum / USD — 2024
Assumed trading range: $500 to $4,500
Grid interval: Buy every $100 drop
Position size per trade: 0.25 ETH
Total profit-taking cycles: 178
Total profit: $5,340.00
Risk profile: Position sizing adjusted to remain close to 1x exposure
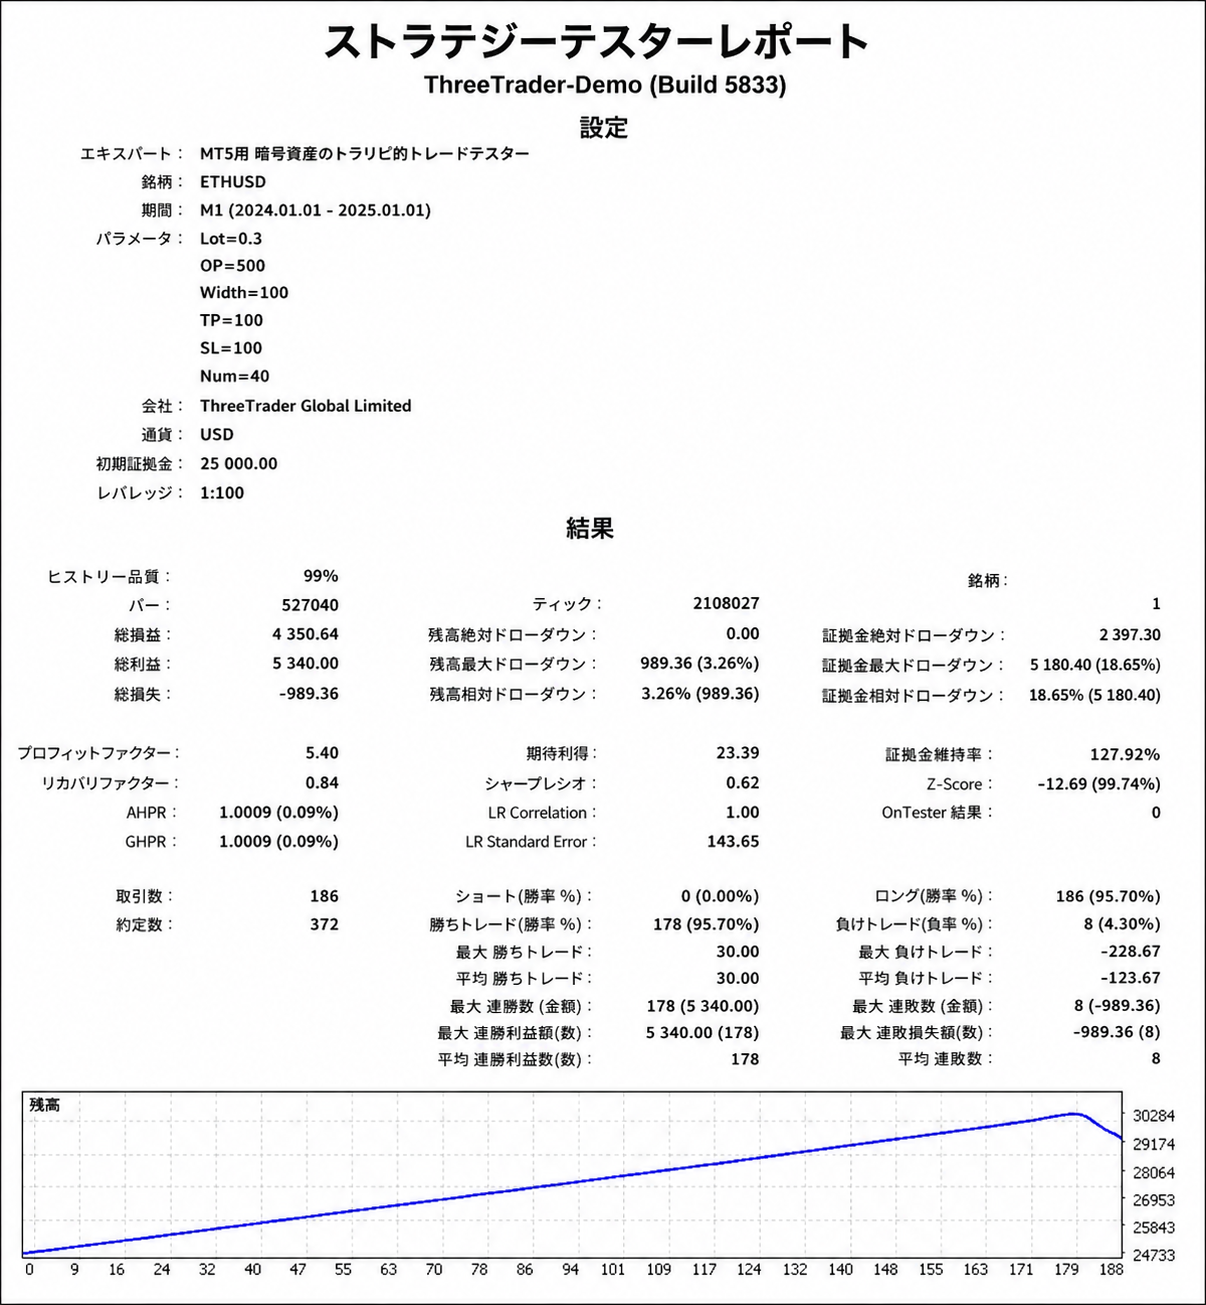
In this test, Ethereum was traded repeatedly within the $500–$4,500 range.
The strategy bought 0.25 ETH every time the price dropped by $100 and sold 0.25 ETH whenever the price rebounded by $100.
During 2024, the system completed 178 profit-taking cycles, generating approximately $5,340 in profit.
Ethereum / USD — 2025
Assumed trading range: $1,000 to $5,000
Grid interval: Buy every $100 drop
Position size per trade: 0.2 ETH
Total profit-taking cycles: 220
Total profit: $5,500.00
Risk profile: Position sizing adjusted to remain close to 1x exposure
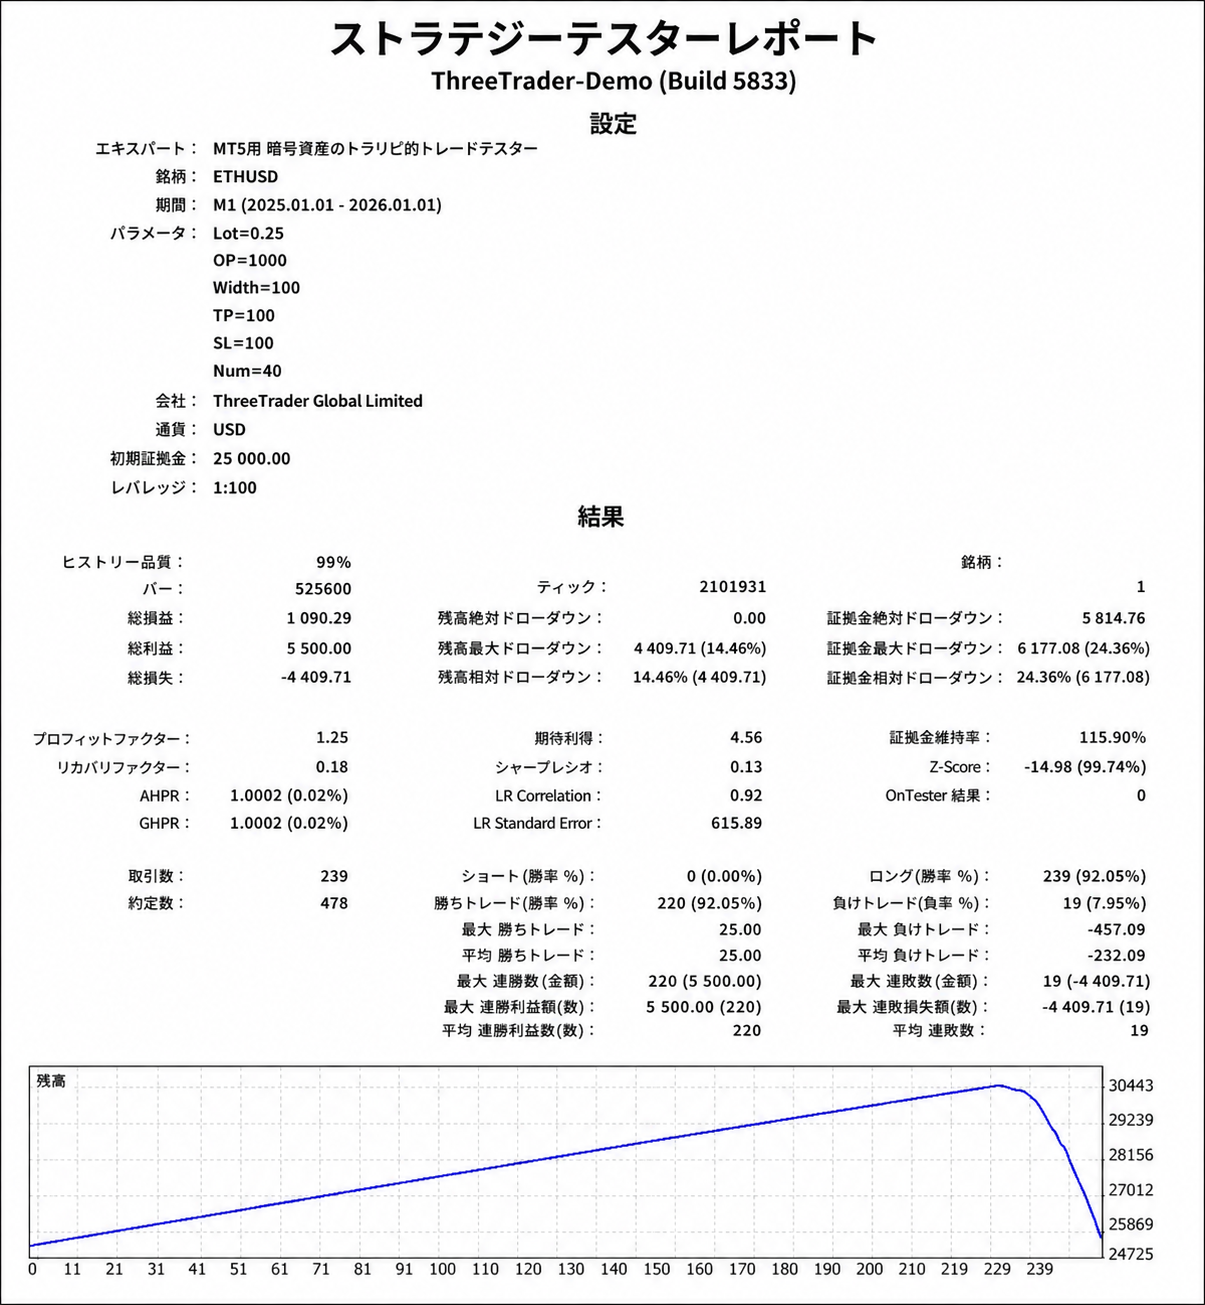
In this test, Ethereum was traded repeatedly within the $1,000–$5,000 range.
The strategy bought 0.2 ETH every time the price dropped by $100 and sold 0.2 ETH whenever the price rebounded by $100.
During 2025, the system completed 220 profit-taking cycles, generating approximately $5,500 in profit.
The results shown in this article are based on historical market data and do not guarantee future performance.