
Historical Backtest Results Using Real Market Data
At this point, you should already have a general understanding of how this grid trading approach works in cryptocurrency markets.
However, the obvious questions are:
- Does it actually generate profit?
- What kind of returns are realistically possible?
In this article, I’ll show examples of how this strategy performed when applied to historical cryptocurrency price data.
Why Evidence Matters
One of the biggest issues in trading is that performance claims can easily be manipulated.
People can:
- Show only profitable periods
- Edit screenshots
- Hide losses and drawdowns
That makes many trading results difficult to trust.
For that reason, this article uses fixed historical periods and applies the strategy’s trading rules directly to historical market data.
The testing conditions are also disclosed so that anyone can independently verify whether the results are reasonable.
If necessary, you can even verify the results yourself by reviewing historical charts or conducting independent backtests.
Backtest Conditions
The following conditions were used for the tests.
- Initial capital: $25,000
- Assets tested: BTC/USDT and ETH/USDT
- Test period: 2023–2025 (evaluated year by year)
- Platform used: MT5 (MetaTrader 5)
- Strategy type: Buy-only grid trading
- Risk profile: Low leverage, designed to behave similarly to spot trading
The tests below are historical backtests that calculate profit and loss by applying the strategy to past market data.
The logic behind the settings, position sizing, and return structure will be explained in later articles.
Bitcoin Backtest Results
First, let’s look at Bitcoin performance over the past three years.
Depending on the data source and software used, small differences may occur, but the results were approximately as follows:
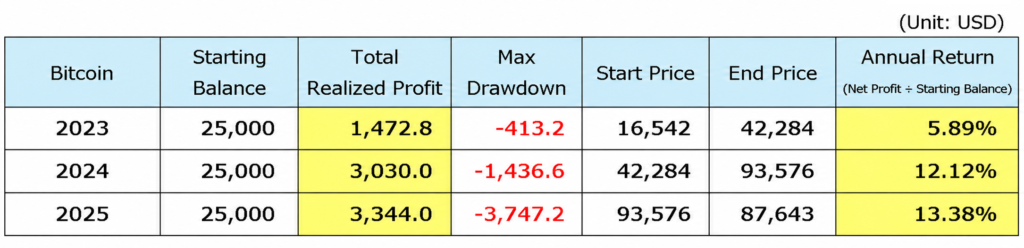
For example, in the 2025 test above, a $25,000 account operating with roughly 1x exposure generated approximately $3,344 in annual profit.
That corresponds to an annual return of approximately 13.38%.
Some readers may reasonably ask:
“Were these tests actually performed?”
“What settings were used?”
To address that, the original MT5 backtest reports are provided below.
→ Crypto Grid Trading Backtest Results & Evidence
Ultimately, the best way to evaluate the strategy is to examine the market behavior yourself.
You can review historical price data manually and observe the repeated market swings, or independently verify the logic using your own backtesting tools.
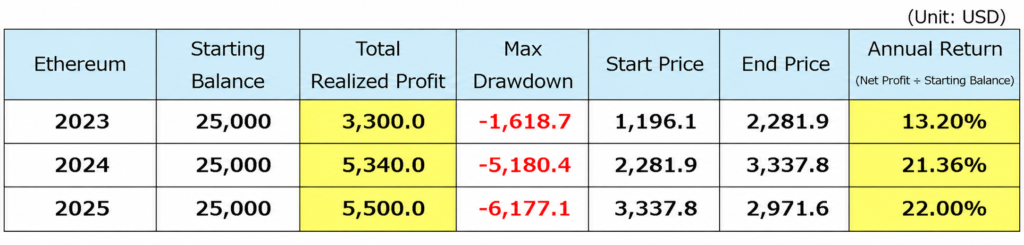
Ethereum Backtest Results
The same structure was also tested on Ethereum.
The results over the past three years were approximately as follows:
Additional Notes
A few important points should be clarified.
Unrealized Losses
Some readers may ask whether unrealized losses should be deducted from the displayed returns.
This strategy assumes that temporary drawdowns are eventually recovered over time.
Because grid trading scales into positions as prices decline, unrealized losses naturally occur during operation.
The strategy is designed with that assumption in mind.
Performance Differences Between Years
The differences in returns between 2023 and the 2024–2025 period are likely related to Bitcoin’s halving cycle.
Historically, market activity increased significantly around and after the 2024 halving period.
That increase in volatility created more opportunities for repetitive execution.
Returns Are Not Guaranteed
The returns shown here are based entirely on my own strategy settings applied to historical market data.
They do not guarantee future profitability.
Specific settings and strategy design logic can be reviewed in the backtest reports and later articles.
→ Crypto Grid Trading Backtest Results & Evidence
Key Takeaways
The conclusion is fairly simple.
- Repetitive trading works when markets continue moving
- Higher volatility generally improves profitability
- Better strategy design can significantly improve results
As long as markets continue to move, this strategy can continue functioning.
In fact, some carefully selected altcoins may produce stronger performance than Bitcoin or Ethereum due to their higher volatility.
However, there is an important risk to understand.
The Strategy Alone Is Not Enough
Simply running a grid strategy is not enough.
Even when using the exact same logic, results can vary dramatically from trader to trader.
Why?
Because the design matters.
- Which assets are selected
- What price ranges are used
- How capital and position sizing are structured
Even with the same strategy, different designs can produce completely different outcomes.
What Comes Next
At this point, you should have a clearer understanding of how this strategy functions in real market conditions.
The next question is:
How should the strategy actually be designed?
In the next article, I’ll explain the full structure behind this strategy.
→ The Full Structure of This Crypto Grid Trading Strategy
The results shown in this article are based on historical market data and do not guarantee future performance.